As a developer who uses Google Chrome as their primary browser to develop with, it’s beneficial to be aware of all of the tools Chrome offers developers to work with their code in a powerful way. Understanding all of the tools and knowing how to use them efficiently is something worth learning as it will help improve your productivity massively when developing a site.
Let’s discuss some of the most powerful and useful developer tools you may not be aware exist and how they can help your workflow.
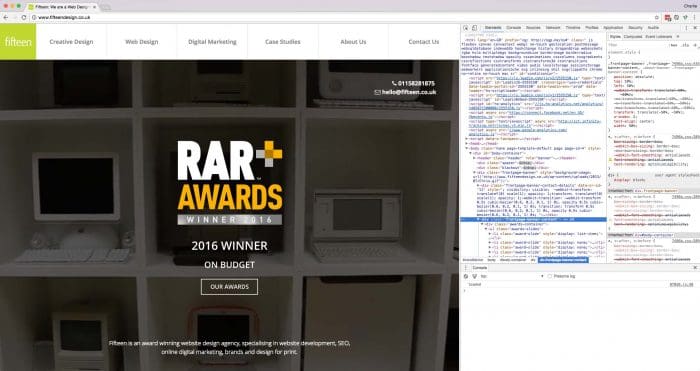
Introducing: DevTools
But for some of you, who may not know what the DevTools are, let’s discuss the basics. Every browser offers DevTools. It allows you to inspect the HTML, CSS, JavaScript and other components of your site. It’s a potent tool that will enable you to edit your website’s code in real time, without affecting the actual files themselves. Essentially, it is incredibly useful for trying out new code and modifying existing code to alter it in a way that satisfies your needs, before changing the real files for the site.
You can access the DevTools in a few ways, one of the easiest is by right-clicking anywhere on a website and pressing ‘Inspect’. Alternatively, you can use keyboard shortcuts including ‘CMD + ALT + I’ on a Mac or ‘F12’ on a Windows PC.
Device Mode
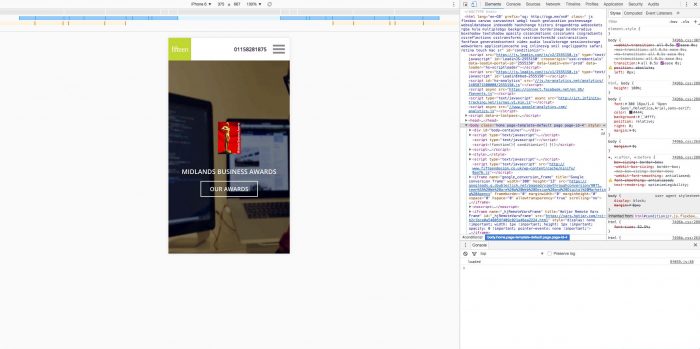
The device mode on Google Chrome is my favourite tool on offer. It’s a fantastic and powerful tool that allows you to view a website as it would appear on a different device by simulating the screen resolution.
To access this, after accessing the developer tools by pressing ‘Inspect’ on the web page, look for the button of two small devices which, when pressed, will toggle the device toolbar.
You can access a range of devices and custom resolutions by using the drop-down box and selecting a range of iPhones, Android devices as well as custom laptops screen resolutions. You can enter custom resolutions by typing in the resolution. Additionally, you can also use the responsive bars just below the drop down box to scale the responsive menu utilizing a drag and drop method.
Color Picker
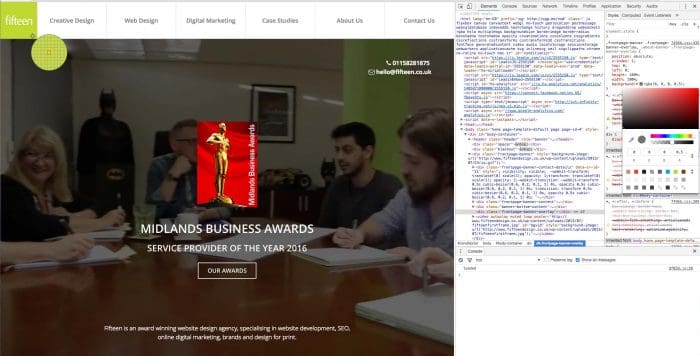
This excellent colour picker built into the DevTools will help you save a lot of time when identifying brand colours on a site and getting not just the HEX code of a colour but also the RGBA and HSLA values at an instant.
To access it, it’s easy, find an element within the DevTools that uses a colour property, such as a paragraph with some colour styling added. Once there, within the styles on the DevTools, select the colour box styling on the element, and you’ll be able to use the colour picker to choose any the colour of a single pixel on the web page. Then, within the colour picker in the DevTools, use the toggle button to cycle through RGBA, HEX and HSLA codes for a colour.
Forcing An Elements State
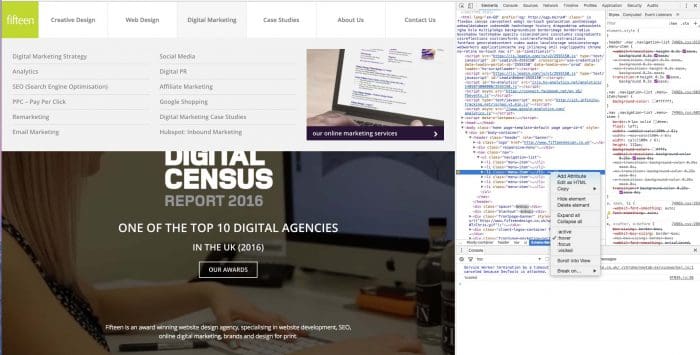
When working with pages with interactive elements, such as buttons that when hovered over change colour, it can be awkward to monitor their state within the DevTools and change properties of the hover. Luckily, you can temporarily force the state of an element within the DevTools, which will allow you to work on the hovered state with ease. Just find an element, which has a hover state attached to it, and inspect it to load it up in the DevTools.
Here, right-click on the element and select a state. I’ve used, hover and you can see within the browser window that it has added the hover class to the element and the navigation menu has appeared. Now, we can edit the hover state within the DevTools.
Quick File Switching
You can also use the DevTools Sources tab to view and modify the source your page is made up of. Typically, the sources tab contains a lot of files and it can get very confusing. Luckily Chrome recognises this and has included a feature that allows you to search and switch between sources files similarly to the way you would in Sublime Text, by using ‘CMD + P’ on Mac or ‘CTRL + P’ on Windows.
You can also use the arrows keys to cycle through files of a similar name and use enter to select the highlighted file.

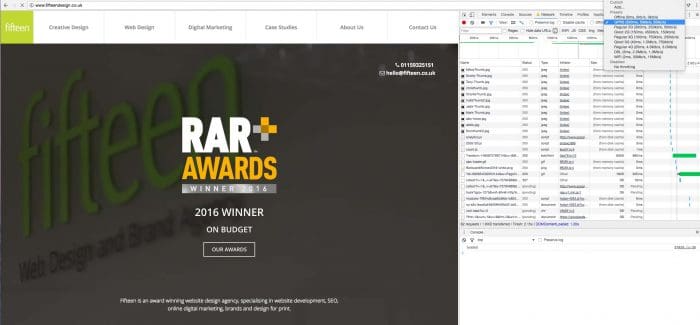
Network Throttling Simulation
Chrome allows you to simulate Network Throttling profiles. Within the Network tab in the DevTools, you’ll notice an option for ‘No Throttling’. If you select this, you can choose between a bunch of preset Throttling settings such as 2G, 3G and GPRS connections. This is great to simulate the load times of individual elements and components on a web page. You can refresh the page using the Network Throttling you have selected by pressing CMD + R, and you’ll see the load time breakdowns within the developer tools.
Lighthouse Audits
Another great feature to the Chrome DevTools is Lighthouse. Google Lighthouse audits your site and gives technical point to improve site usability and work on elements that can hinder the site from a user experience POV, especially from mobile. Launch Lighthouse by choosing the Audit option, on your website or someone else’s, and Lighthouse will run audits for performance, accessibility, SEO, progressive web apps, and more. Read more about Lighthouse here.

With Developer Tools, it takes time to master and understand everything that is available to you. I’m finding new ways to approach editing my code within the DevTools every day, and Google continues to support developers by adding more features frequently.
If you have just dipped a toe into web development, make sure you avoid these rookie errors. Also, have a read on why designers and developers should work together more.